The reason why most substances are weakly paramagnetic (tend to strengthen the applied magnetic field) is that their electrons, being bound up in current loops about massive atoms, experience a torque when exposed to an externally applied magnetic field. This torque aligns the atomic magnetic moment with the magnetic field.
In contrast, conductors and plasmas are Larmor-diamagnetic. The charge carriers (electrons in metals, electrons and ions in plasmas) can move freely, so the magnetic field exerting forces on them bends them into current loops with oppositely directed magnetic moment. (There is also Langevin diamagnetism where the applied field induces some sort of precession of the orientation of a bound electron orbital, leading to a current, leading to a magnetic moment against the applied field)
(Also, there is ferromagnetism, in which a substance is very strongly and nonlinearly paramagnetic. I don’t have an extremely solid grasp on how this works yet, but it seems the bound charge carriers in the atoms (of which there are many unpaired) must be overcoming what the free charge carriers in the conduction band are doing to induce diamagnetism).
One of the things about paramagnetism that bugged me was that if you have a paramagnetic gas like Oxygen, where the atomic electron shells are widely separated, or an atomic system where the size of the relevant current loops is far smaller than the interatomic spacing of the system, then it isn’t obvious that a bunch of magnetic moment dipoles aligned with the B field would produce induced fields which reinforce the applied field internal to the substance.
One argument you could make is that:
1. far from the dipoles, outside the boundaries of the paramagnetic substance, the net action of all the magnetic dipoles produces a field opposing the applied field.
2. B fields are solenoidal (unless you have magnetic monopoles floating around in your substance, in which case there’s a bunch of guys in Sweden who might be looking for you….)
3. Therefore the average induced field in the substance must reinforce the applied field.
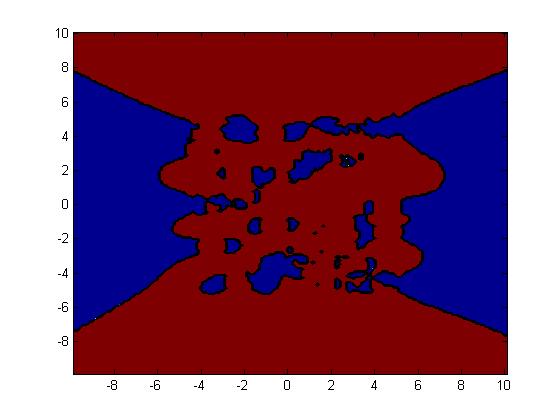
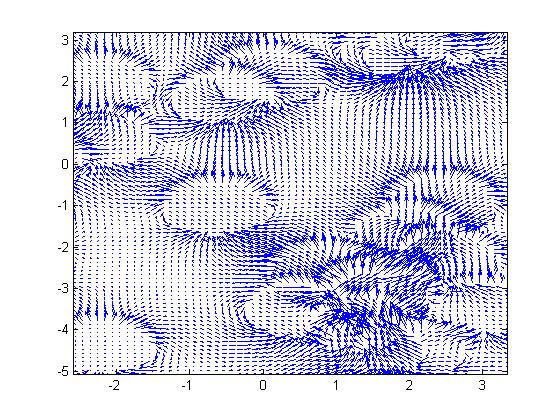
Or, you could, like me, want to see it. I like being able to see things, with my minds eye or otherwise. This matlab script produces a visualization of the induced field of a bunch of randomly distributed dipoles aligned along the +y axis, and in what regions the +y component is greater than 0.
It turns out that the fields of individual dipoles tend to link up in the body of the substance, pushing the region where they oppose the applied field outside of the boundaries of the substance.
main script: Dipolefield.m
subroutine: infdipole.m
Comments (0)